In these times of market volatility, your clients should know how fixed indexed insurance products can protect the cash value in their policies during market downturns. Indexed insurance products, like certain Indexed Universal Life insurance policies (IULs), do not directly participate in any stock or equity investments—instead, they use an indexing method to credit interest on a policy so that if the rate of return is negative, their interest rate goes no lower than zero. At a time when Americans have seen the market take a dramatic dip since last year’s gains, indexing makes more sense than ever before.
The 0% floor on fixed indexed insurance products means shorter recovery times after financial crises and more years of positive interest in total.
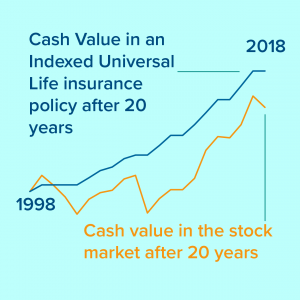
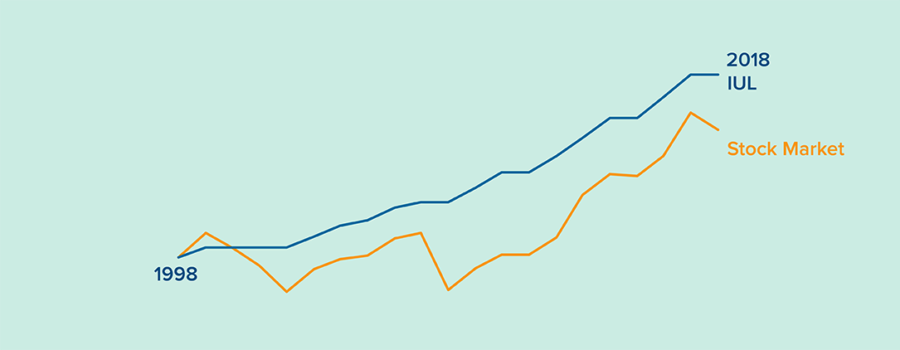
For example, if you put $100,000 of your money in the stock market in 1998, you would have lost almost 30% of it by 2002. If you had purchased an IUL policy and put $100,000 in cash value in that policy, you would have gained 8% in 1999 and wouldn’t have lost any of it during the 2000, 2001, and 2002 down years. Even with market gains from 2003-2007, your stock investment wouldn’t catch up to the cash value of an IUL. After 20 years, your IUL cash value will have grown to $248,636 in 2018, while your stock investment would still be behind at $203,912. *
 With indexing, zero is your hero. When the market takes a dip, your interest stays safe at zero, ready to leap back to positive rates at the first sign of recovery.
There’s a chance your client doesn’t know about the benefits of indexing, and the recent market downturn is your best chance to promote the benefits of indexed products. IULs are even bigger protection at this time, without any of the risks of a market downturn. No matter what, indexing is a win in all market conditions—use this to your advantage in the coming weeks! Now is the time for your client to see the power of indexing.
For FFS Agents, learn more about sharing indexing tips with your clients in our ABO article.
*Past performance is not an indication of future results. This hypothetical example shows the growth of $100,000 invested in 1998 with an indexed strategy as compared to the returns of the S&P 500. Index Strategy assumes an annual point to point with an 8% cap. S&P 500 returns provided by Morningstar and dollar amounts calculated by FFS. Results may vary. FFS does not offer investment advice.


